Table of Contents
- Build a Pie Chart Template for Microsoft Excel – Step-by-Step Instructions
- Pie Chart Templates & Examples in Microsoft Excel
- Marketing Strategy Pie Chart in Microsoft Excel
- Health Facts Pie Chart in Microsoft Excel
- Social Media Pie Chart in Microsoft Excel
- 3D Pie Chart in Microsoft Excel
- Infographic Pie Chart Template in Microsoft Excel
- FAQs
How To Make/Create a Pie Chart in Microsoft Excel [Templates + Examples] 2023
Pie charts are a classification of charts or graphs that individuals or organizations use to represent portions of a whole, especially data on different matters. Pie charts are called such since the shape and representation of numerical data are in a sphere or circle, similar to a pie.

Build a Pie Chart Template for Microsoft Excel – Step-by-Step Instructions
Microsoft Excel is a database and spreadsheet software program from the Microsoft Office suite for creating, analyzing, and visualizing data for teams and individuals. It is a valuable tool for organizations to organize their data into easily digestible information and visualization for clients and stakeholders.
-
Step 1: Open Microsoft Excel
Begin using and developing a pie chart by opening the Microsoft Excel application on the computer or electronic device. Look for the program using the Start menu or look for the shortcut icon on the taskbar or desktop.
-
Step 2: Search for a Pie Chart Template (Option 1)
Look for creative and visually appealing pre-made templates from websites, including Template.net, when developing a graphic design document to share with stakeholders. Go to the pie chart landing page and select an appropriate pie chart template to use.
-
Step 3: Use the Search Bar (Option 2)
Aside from using the landing page, people can also utilize the search box on Template.net’s homepage. Input the pie chart template on the search bar to check out the different categories of pie charts.
-
Step 4: Choose a Pie Chart Template
Select a pie chart template that is appropriate for the data that an individual, group, or organization produces from a research paper. Click on the pie chart template image to access the website’s editor tool to edit the document online.
-
Step 5: Select Excel File Format
After selecting the template, choose the Excel file format from the dropdown menu, and download the file on the computer or device.
-
Step 6: Download the Excel File
After downloading the timeline Excel file, look for the designated folder for the downloaded file. Double-click on the file to open the pie chart template, editing its contents on the program.
-
Step 7: Document Title
Change the title of the pie chart template according to the subject or content of the data that an individual or a group prepares.
-
Step 8: Data Table
Create a data table and incorporate the necessary data for the pie chart using percentages, currencies, and other number formats.
-
Step 9: Pie Chart Title
Insert the title that best represents the data incorporated in the pie chart.
-
Step 10: Pie Chart with Values
Generate the pie chart to represent the data on the datasheet, making sure that each section of the pie chart has corresponding colors for each category.
-
Step 11: Legends
After developing the pie chart, the Excel program generates a legend corresponding to the value and colors of the categories on the pie chart.
-
Step 12: Finalize and Save
After editing the contents of the pie chart, save all the revisions and changes to the document by clicking on the Save As button.
Pie Chart Templates & Examples in Microsoft Excel
Use pie chart templates to record data sets for personal or business use, constructing budgets, research data, and other generated information through numerical values. There are beautiful and unique pie chart templates to complete graphic design charts for presentations or personal journals and files.
Marketing Strategy Pie Chart in Microsoft Excel
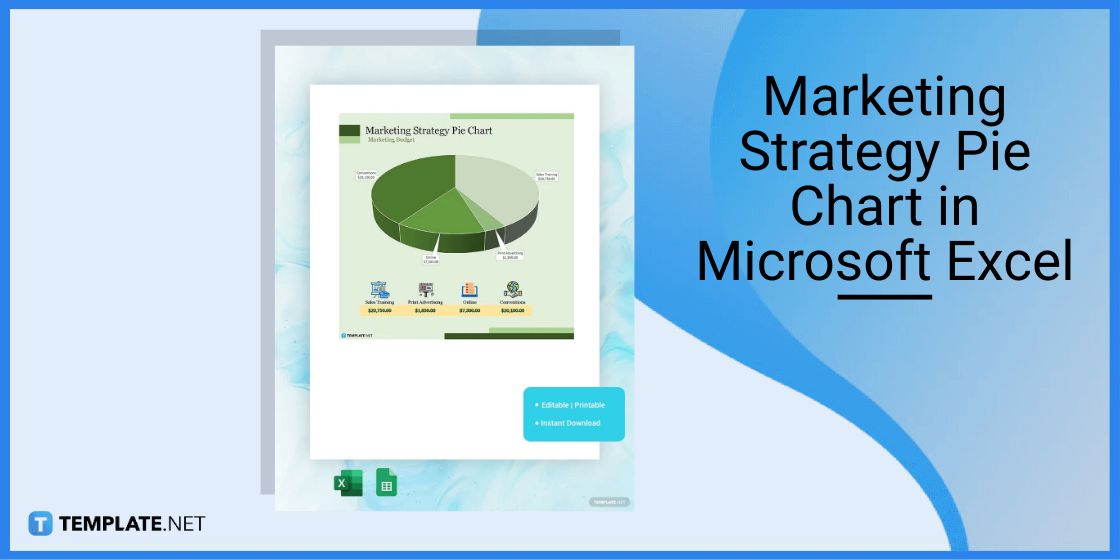
A marketing strategy pie chart contains information and data about a marketing strategy from an organization or a team, detailing the values the individuals need to push a plan forward.
Health Facts Pie Chart in Microsoft Excel
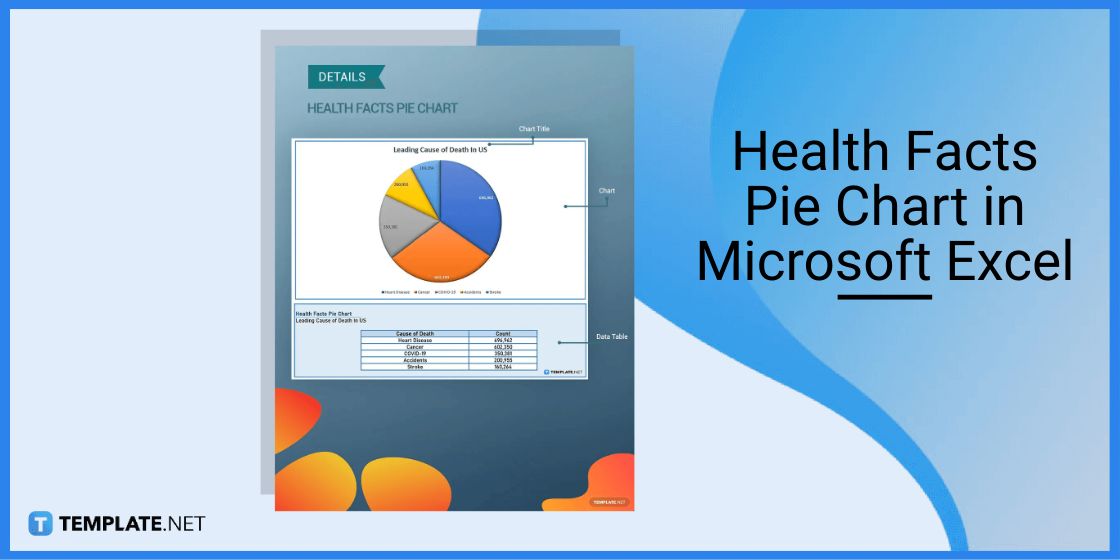
A health facts pie chart helps individuals to monitor their health status, tracking different factors about their health, including running trackers, calorie counters, and sleep trackers.
Social Media Pie Chart in Microsoft Excel
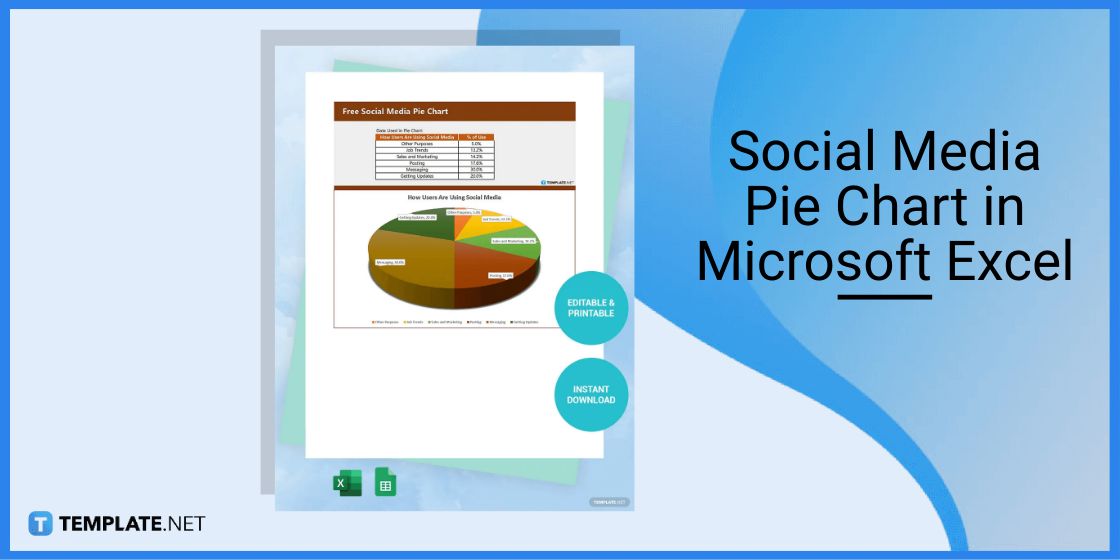
Social media pie charts track and analyze social media data that an organization deals with on a daily, weekly, monthly, or quarterly basis, noting people’s engagement and interactions.
3D Pie Chart in Microsoft Excel
The 3D pie chart makes a 3D image of the data values an individual incorporates on the data table to represent a data interpretation from a study.

Infographic Pie Chart Template in Microsoft Excel
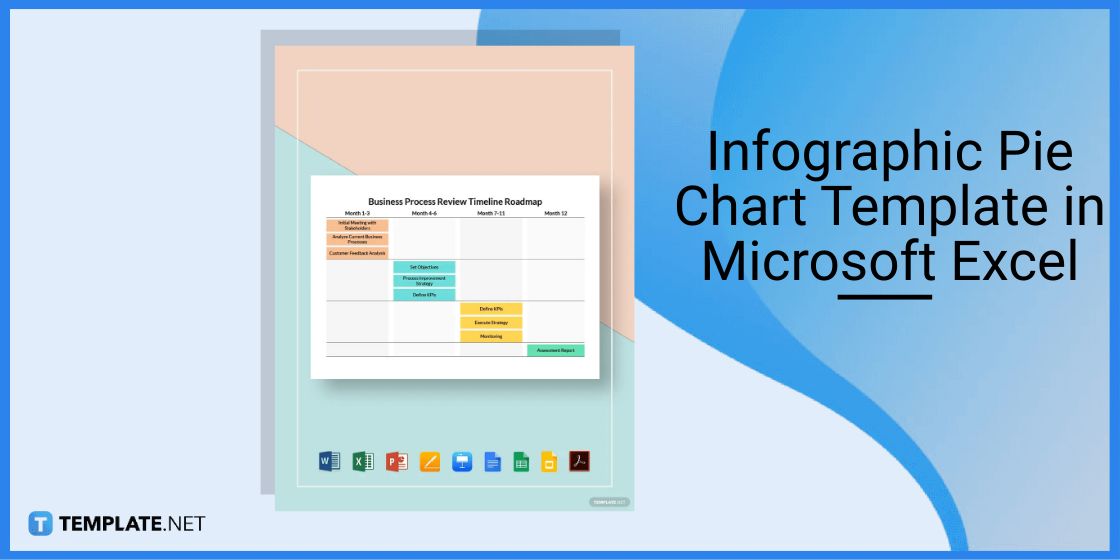
Generate an infographic pie chart to represent data values from different topics and subjects, inserting an icon or clipart to represent the legends for the chart.
FAQs
How to create a pie chart in Excel?
People create a pie chart in Excel by clicking the Insert menu, selecting Pie, and choosing the pie chart design.
How do you make a pie chart with percentages using Excel?
To generate a pie chart with percentages, use the Ribbon tool to develop the percentage values for each item on the table.
How do you format a pie chart in Excel?
To format the pie chart, right-click on the pie chart element, select the Change Series Chart Type, selecting the Pie of Pie or Bar of Pie.

