Table of Contents
- Build a Bar Chart Template for Microsoft Excel – Step-by-Step Instructions
- Bar Chart Templates & Examples in Microsoft Excel
- Construction Bar Chart in Microsoft Excel
- Monthly Bar Chart Template in Microsoft Excel
- Infographic Bar Chart Template in Microsoft Excel
- Business Bar Chart in Microsoft Excel
- Creative Bar Chart Template in Microsoft Excel
- FAQ
How To Make/Create a Bar Chart in Microsoft Excel [Templates + Examples] 2023
Bar charts are graphic and visual representations to summarize a set of categorical data, comparing different categories of this data using rectangular bars. These bars represent a certain value to match the height or length of the visual bar, column, or strip, depending on the graphic design choice of an individual.
Build a Bar Chart Template for Microsoft Excel – Step-by-Step Instructions
Microsoft Excel is a database and spreadsheet application part of the Microsoft Office suite enabling individuals and teams to create and generate reports on different data-centered topics. Incorporate data tables to represent values on the bar chart for a visually appealing and organized display of information, sharing them with stakeholders and clients.
-
Step 1: Open Microsoft Excel
Access the Microsoft Excel application program to start creating a bar graph template. Open the application by clicking on a desktop or taskbar shortcut through the Excel application icon.
-
Step 2: Search for a Bar Chart Template (Option 1)
Select a bar chart template to upload on the Microsoft Excel application and appropriate graphic design to match the contents of the bar chart through the template landing webpage.
-
Step 3: Use the Search Text Box (Option 2)
Aside from looking at the landing page, individuals can utilize the search bar to look for a specific document or graphic design. Input bar chart templates on the search box field to view different bar chart categories and templates.
-
Step 4: Choose a Bar Chart Template
Select a bar chart template to represent the data or information for the company. In the example, select the printable bar chart template to produce a copy for stakeholders, producing copies on white paper.
-
Step 5: MS Excel File Format
Select the Excel file format for the document to access the file using Microsoft Excel. Navigate to the dropdown menu and select the Excel icon.
-
Step 6: Download the Excel File
After downloading the Excel file, access the download folder on the computer or electronic device. If the file is a zip file, extract the appropriate file from the folder and open it on the Excel program.
-
Step 7: Bar Chart Title
The bar chart title provides a general idea of the contents of the bar chart. It gives a brief statement of the values and data that an individual can see when they look at the graphic.
-
Step 8: Scale and Chart
The next section of the document is the bar chart representation coming from the data table that a group or individuals present to their audience. In this case, the x-axis scale represents the number of fixed laptops, and the value on the y-axis denotes a month.
-
Step 9: Add the Data Table
The data table contains data and information from reports, daily logs, or case studies that individuals need to visually create for their audience or stakeholders to share these details in an organized manner.
-
Step 10: Finalize and Save
After editing all the necessary components of the bar chart, people can save the document on their laptops or electronic devices. People also have the option to send the file through email addresses.
Bar Chart Templates & Examples in Microsoft Excel
Develop a bar chart template to help teams and individuals to visualize values and provide organized information to their readers. People can use bar charts for various business documents, including proposals, budgets, and item inventories for business transactions and other activities that require data presentation.
Construction Bar Chart in Microsoft Excel
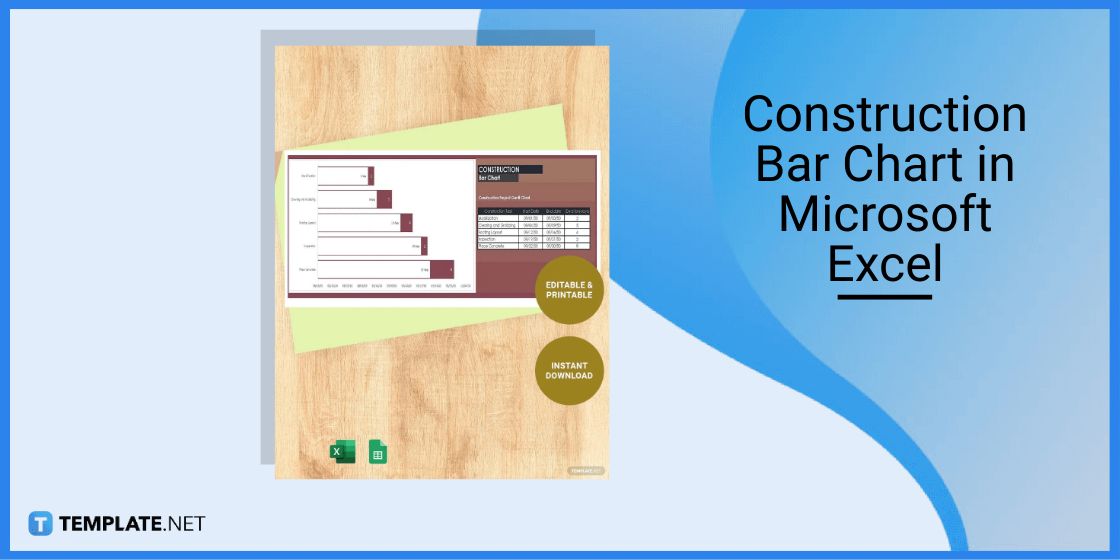
A construction bar chart represents information and data from construction companies and agencies regarding various construction details, visible on graphic materials like flyers and posters.
Monthly Bar Chart Template in Microsoft Excel
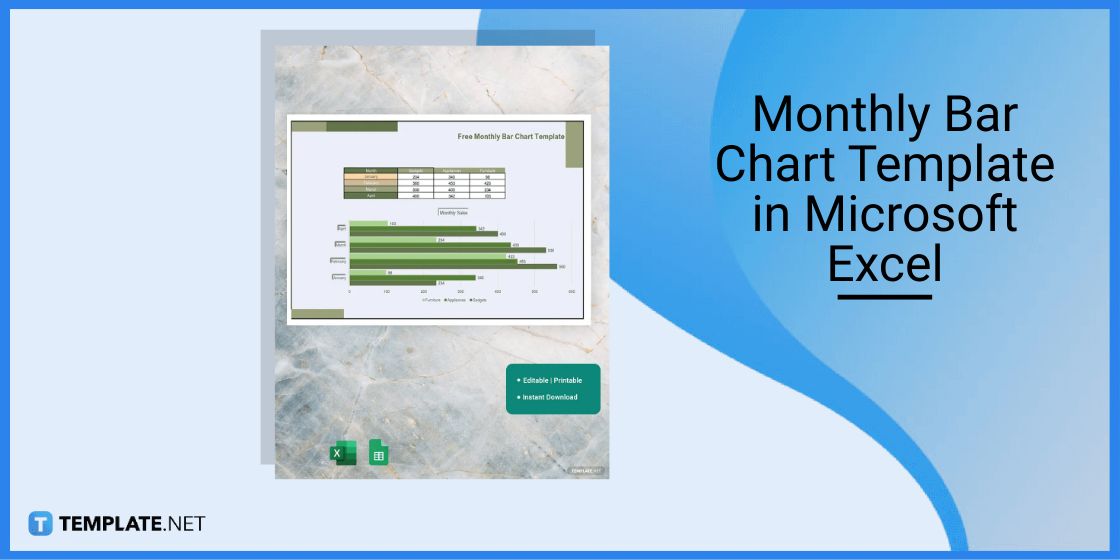
Use a monthly bar chart template to represent values ranging from estimates and survey results to have an organized visual representation of these data.
Infographic Bar Chart Template in Microsoft Excel
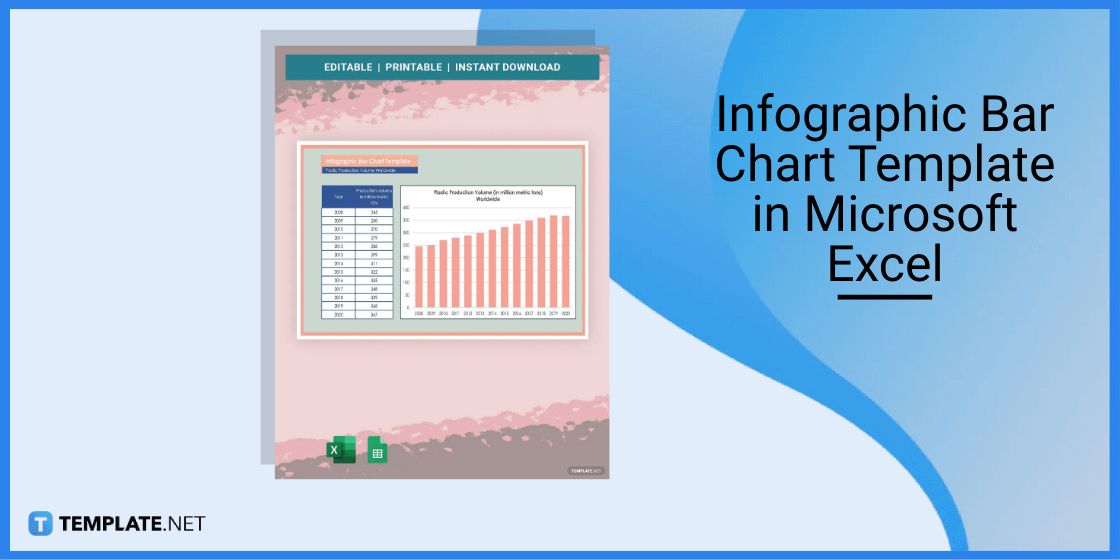
An infographic bar chart template has infographics to help readers and audiences understand presented data through a visual representation using a chart and table.
Business Bar Chart in Microsoft Excel
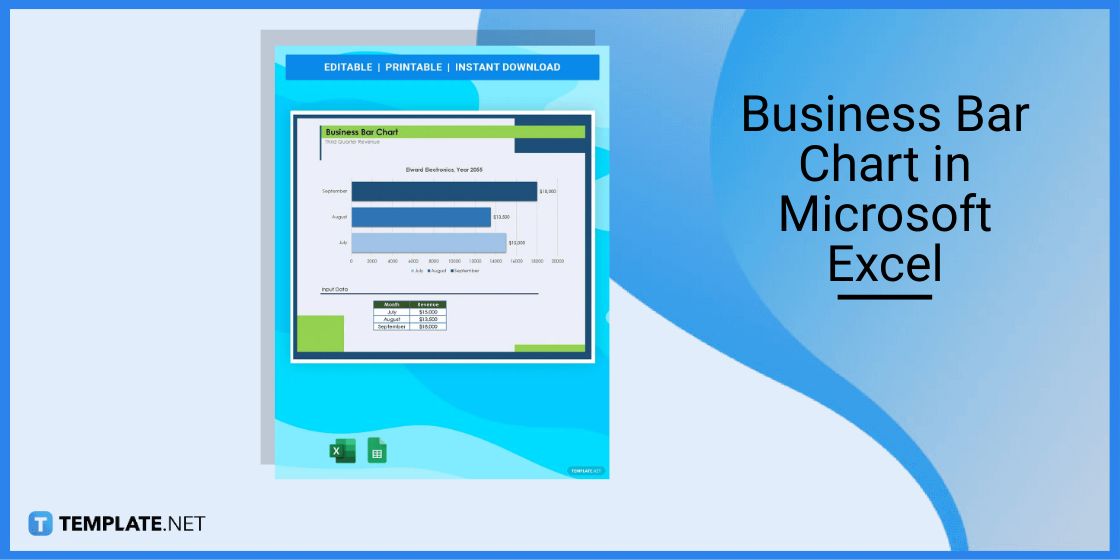
A business bar chart is a valuable graphic tool that businesses and organizations use for their business documents, representing values for presentations.
Creative Bar Chart Template in Microsoft Excel
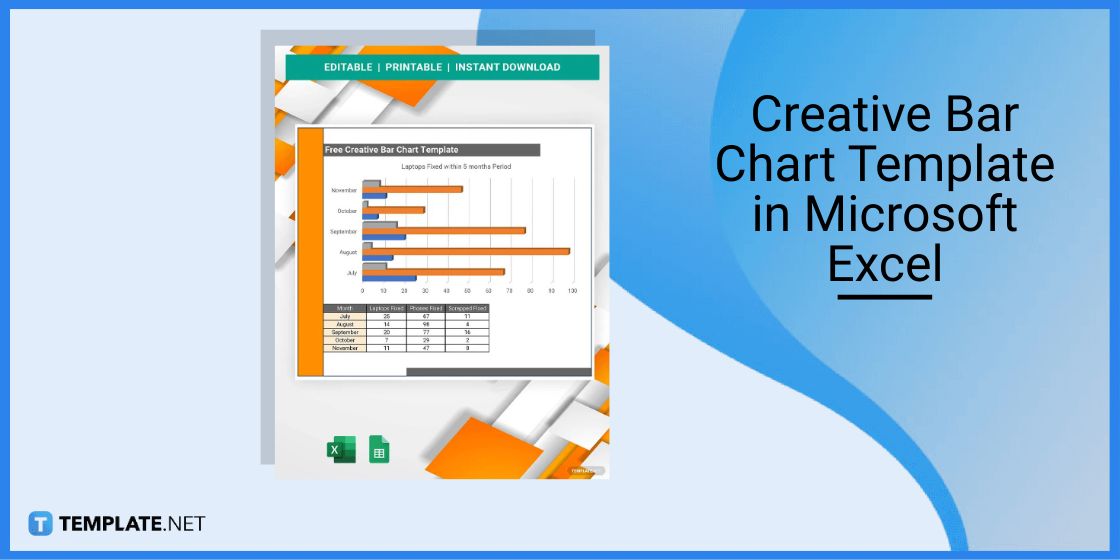
Generate creative bar chart templates that organizations and individuals can use in developing graphic documents and presentations to interact with their clients and stakeholders.
FAQ
How do you create a bar chart in Excel?
To create a bar chart in Excel, create a data table and input all values, highlight the data, click on the Insert tab or menu, and click on the bar chart option.
How to create a bar chart with ranges in Excel?
Develop a range bar chart by inserting a data table, creating a bar chart, and editing the color fill of the bars to highlight the ranges.
How do I download chart templates on Excel?
Go to a template website like Template.net, download different bar chart templates, and upload them in Excel.


