How To Create a Gantt Chart in Microsoft Visio
Microsoft Visio is an application that is part of the Microsoft Office family that users use for diagramming and vector graphics that enables users to develop easy-to-understand visual charts, graphs, and diagrams for presentations. Creating these graphic illustrations helps teams, departments, and organizations to understand numerous procedures, operations, systems, and processes better, including how to create a Gantt chart in Microsoft Visio.

How To Create a Gantt Chart in Microsoft Visio
Gantt charts are essential instruments when planning and scheduling projects for different organizations regardless of their industries, deliverables, or turnaround times. Every organization must have the capacity and knowledge to produce and complete Gantt charts to aid teams and departments in accomplishing projects; the section below introduces steps in creating a Gantt Chart in Microsoft Visio.
-
Step 1 – Develop a Plan and Launch Microsoft Visio

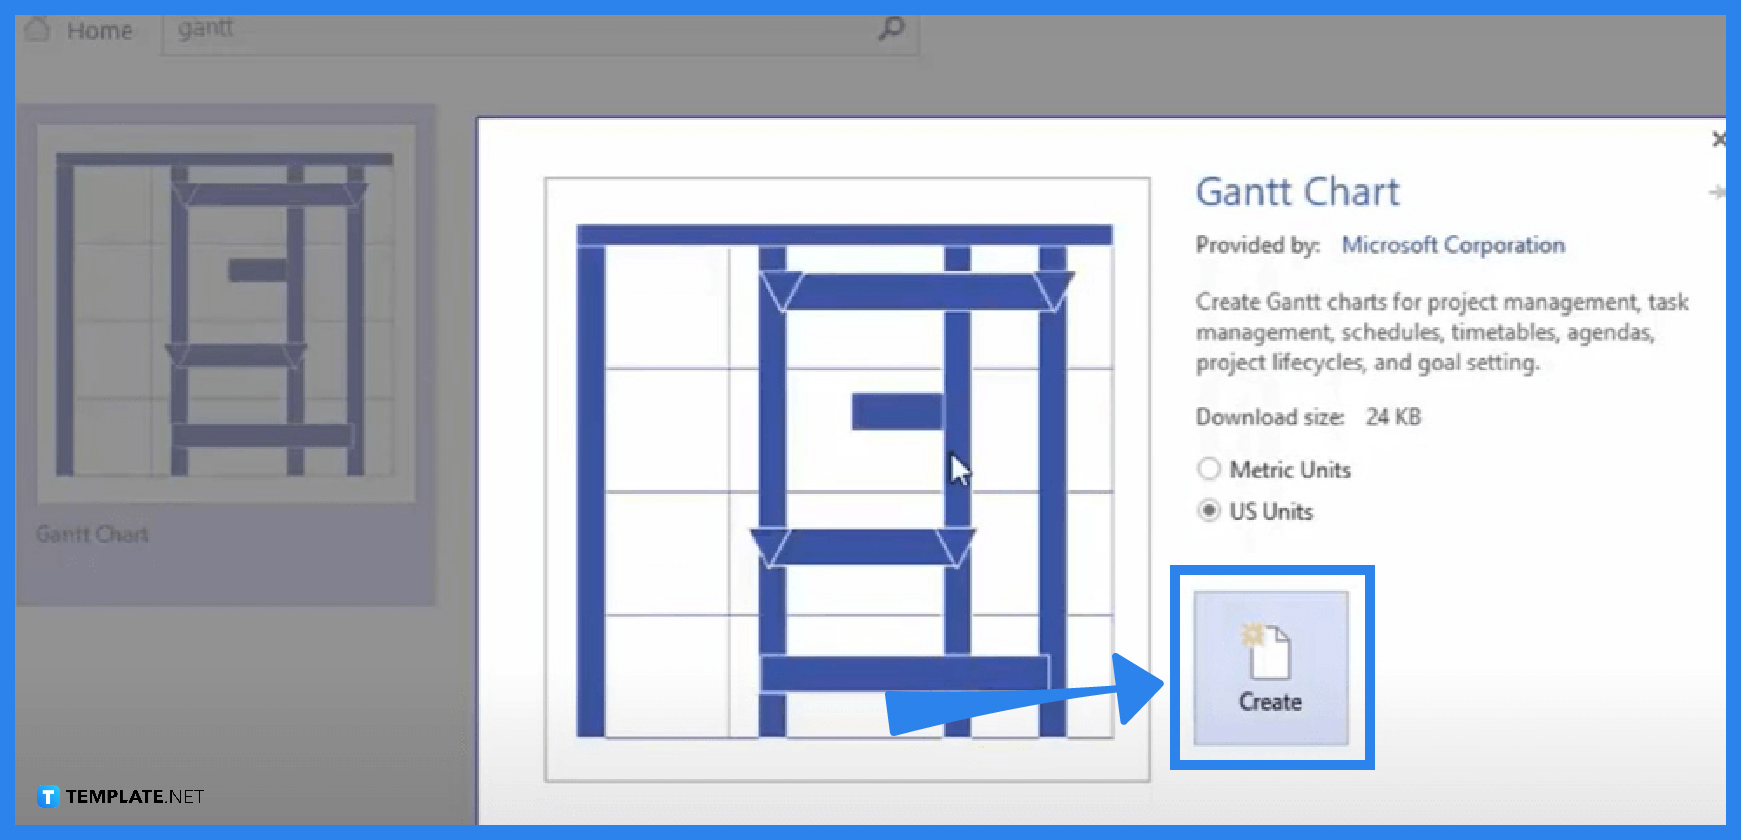
For an individual to create a Gantt chart, they must first know the tool’s functions, and to avoid mistakes while making the Gantt chart, the team or the persons responsible for the project must already have a coherent plan. Open the Microsoft Visio application, and select the Gantt chart tool.
-
Step 2 – Generate a Workable Timeline

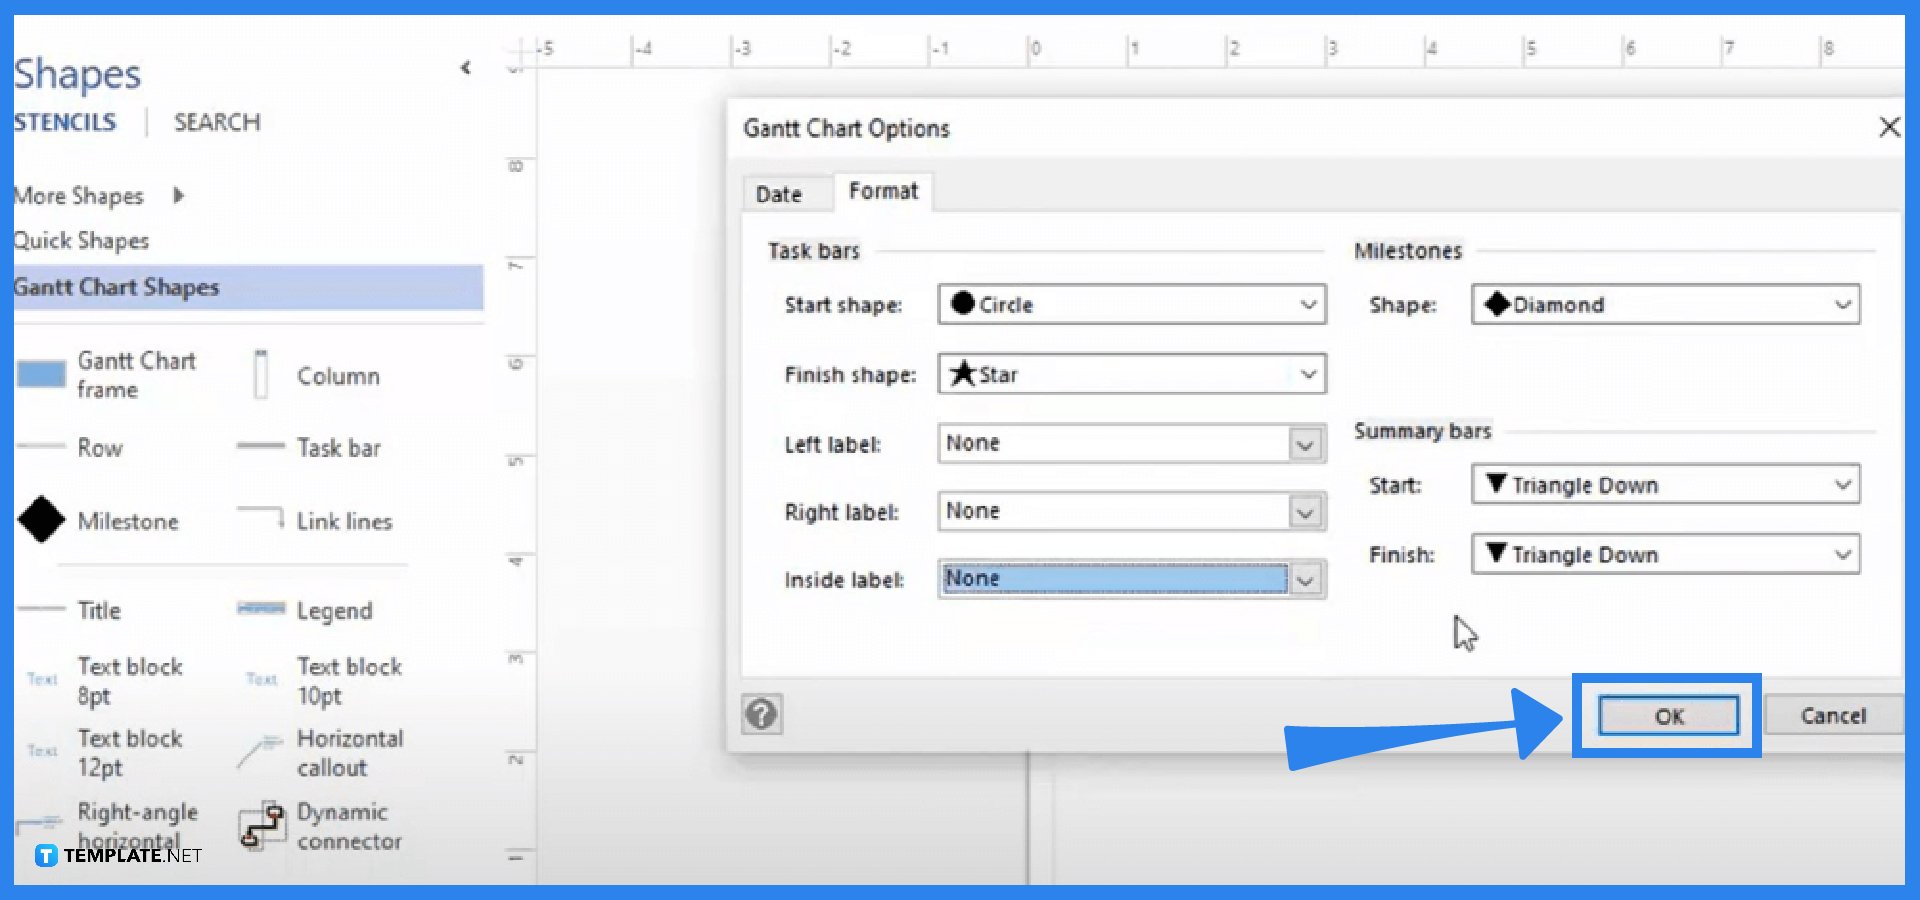
Go to the New tab, select a Gantt chart template from the Microsoft library, and pick the most appropriate one according to the project’s purpose. Input the days and months spent on the project, timescale, and time range. The creator can also incorporate shapes, edit styles, themes, or labels by using the Format option in Visio, and once everything is in place, select the OK button to save changes.
-
Step 3 – Incorporate Information in the Chart

If the individual working on the Gantt chart already has labels set up, they can fill in the information with the specific activities, including time durations to accomplish them. Microsoft Visio allows users to link tasks by selecting them together and clicking the Link option in the Gantt chart bar. Users can also incorporate work done in percentage and make timeline adjustments using the configuration tool.
-
Step 4 – Save the Gantt Chart

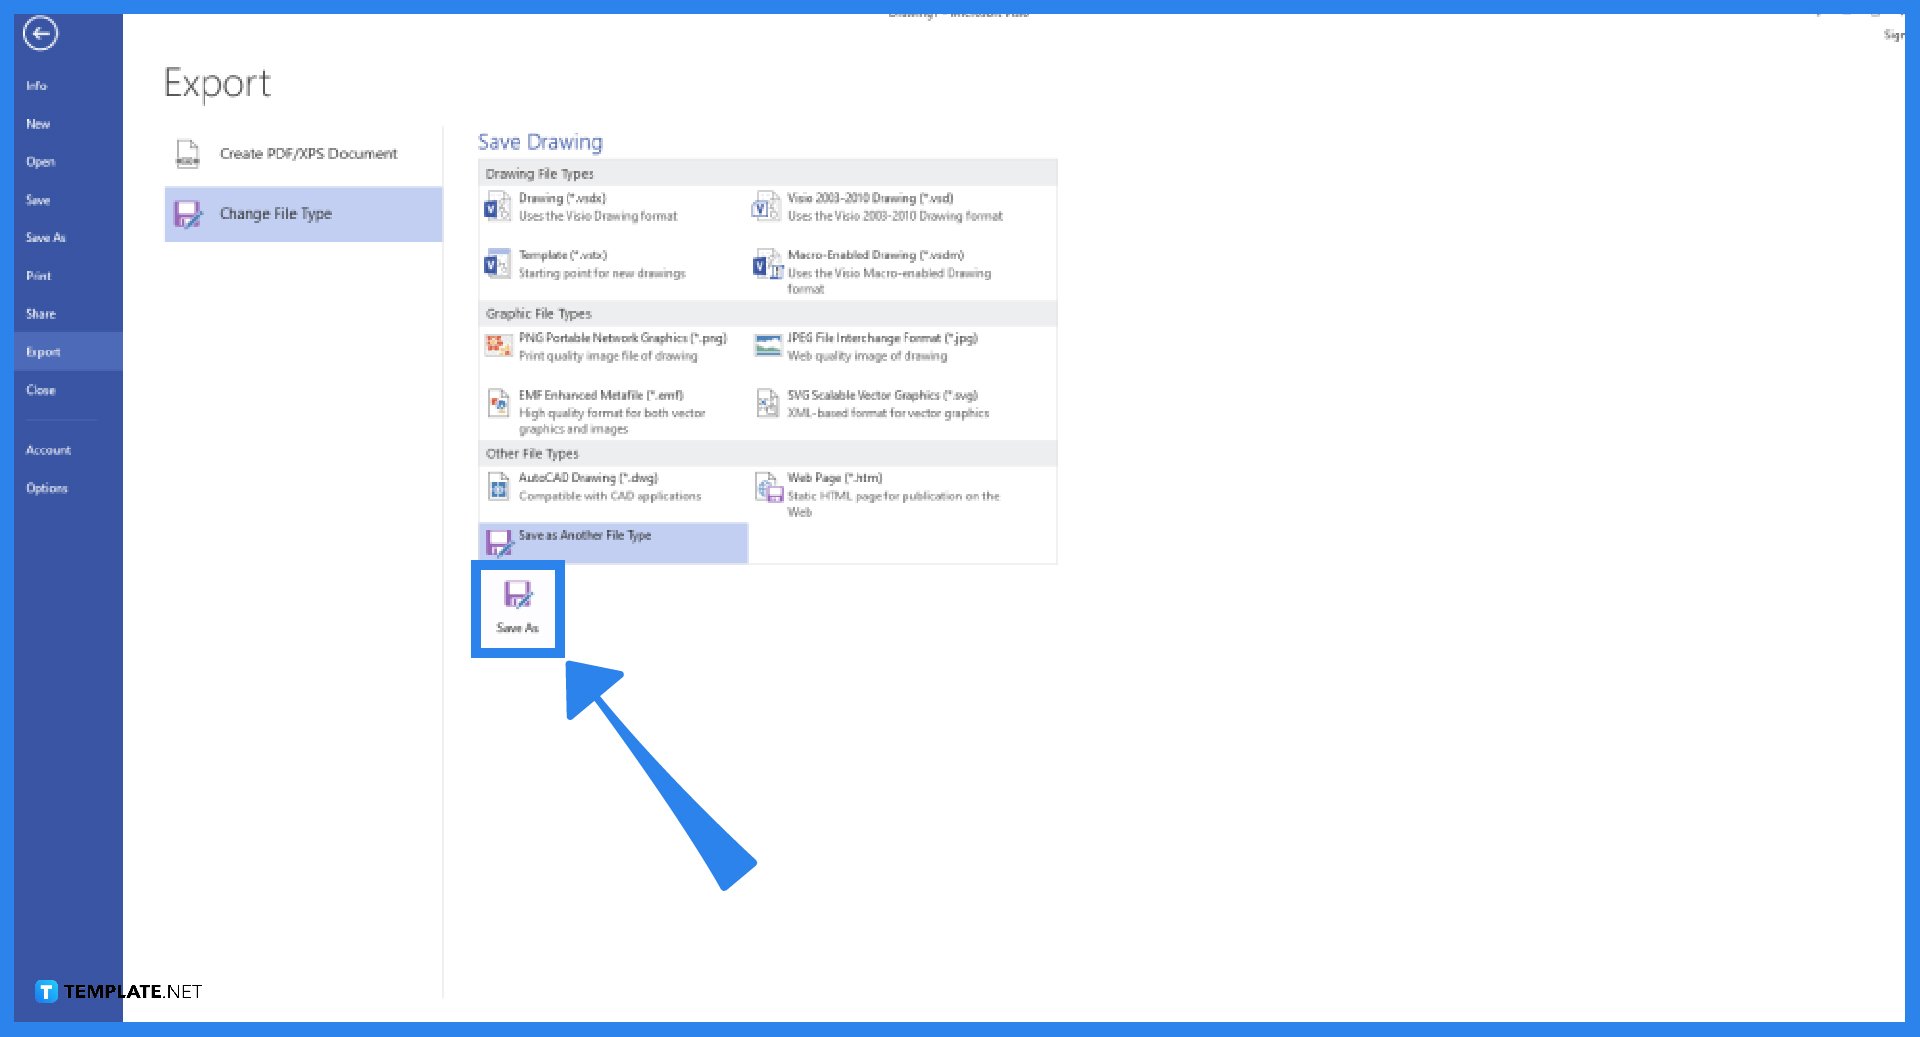
After incorporating the various tasks and their durations, the user can add the project name or title by dragging the text box from the left corner of the window and placing it over the top of the chart while recording leads through the shape data window. Save the Gantt Chart from Microsoft Visio and share it with team members.
FAQs
How do I create a timeline chart in Visio?
Launch Microsoft Visio, click on the File menu, select New, and in the search box, type in ‘timeline’ to view the available templates, and choose the template to work with by clicking the Create button.
What is Visio used for in project management?
Microsoft Visio is still one of the leading tools or applications businesses use in creating enterprise diagrams, workflow diagrams, and Gantt charts to track project progress.
Does Microsoft have a Gantt chart?
Most Microsoft applications cater to users that want to create Gantt charts; Microsoft Project specifically allows users to monitor projects using Gantt charts by running the application, creating a New document, clicking the View menu, and selecting Gantt chart view.

