How to Build Organization Chart Microsoft Visio
Whether you’re working on a diagram for a class report or a floor plan for a building design proposal, Microsoft Visio enables you to do these in one application. Features such as editing projects and collaborating with friends online are also advantages of Microsoft Visio you can utilize when you download the software to your computer.

How to Build Organization Chart Microsoft Visio
Microsoft Visio makes building an organizational chart easier with ready-to-use stencils and templates. These simple steps will guide you in creating your next organization chart:
-
Step 1: Create Organization Chart
To start, open the Microsoft Visio app on your computer. Click “New” on the left side of the screen then choose the Organization Chart template. Once you click that, an Organization Chart Wizard window will pop up but you can just skip that by pressing Cancel.
-
Step 2: Build Organization Chart

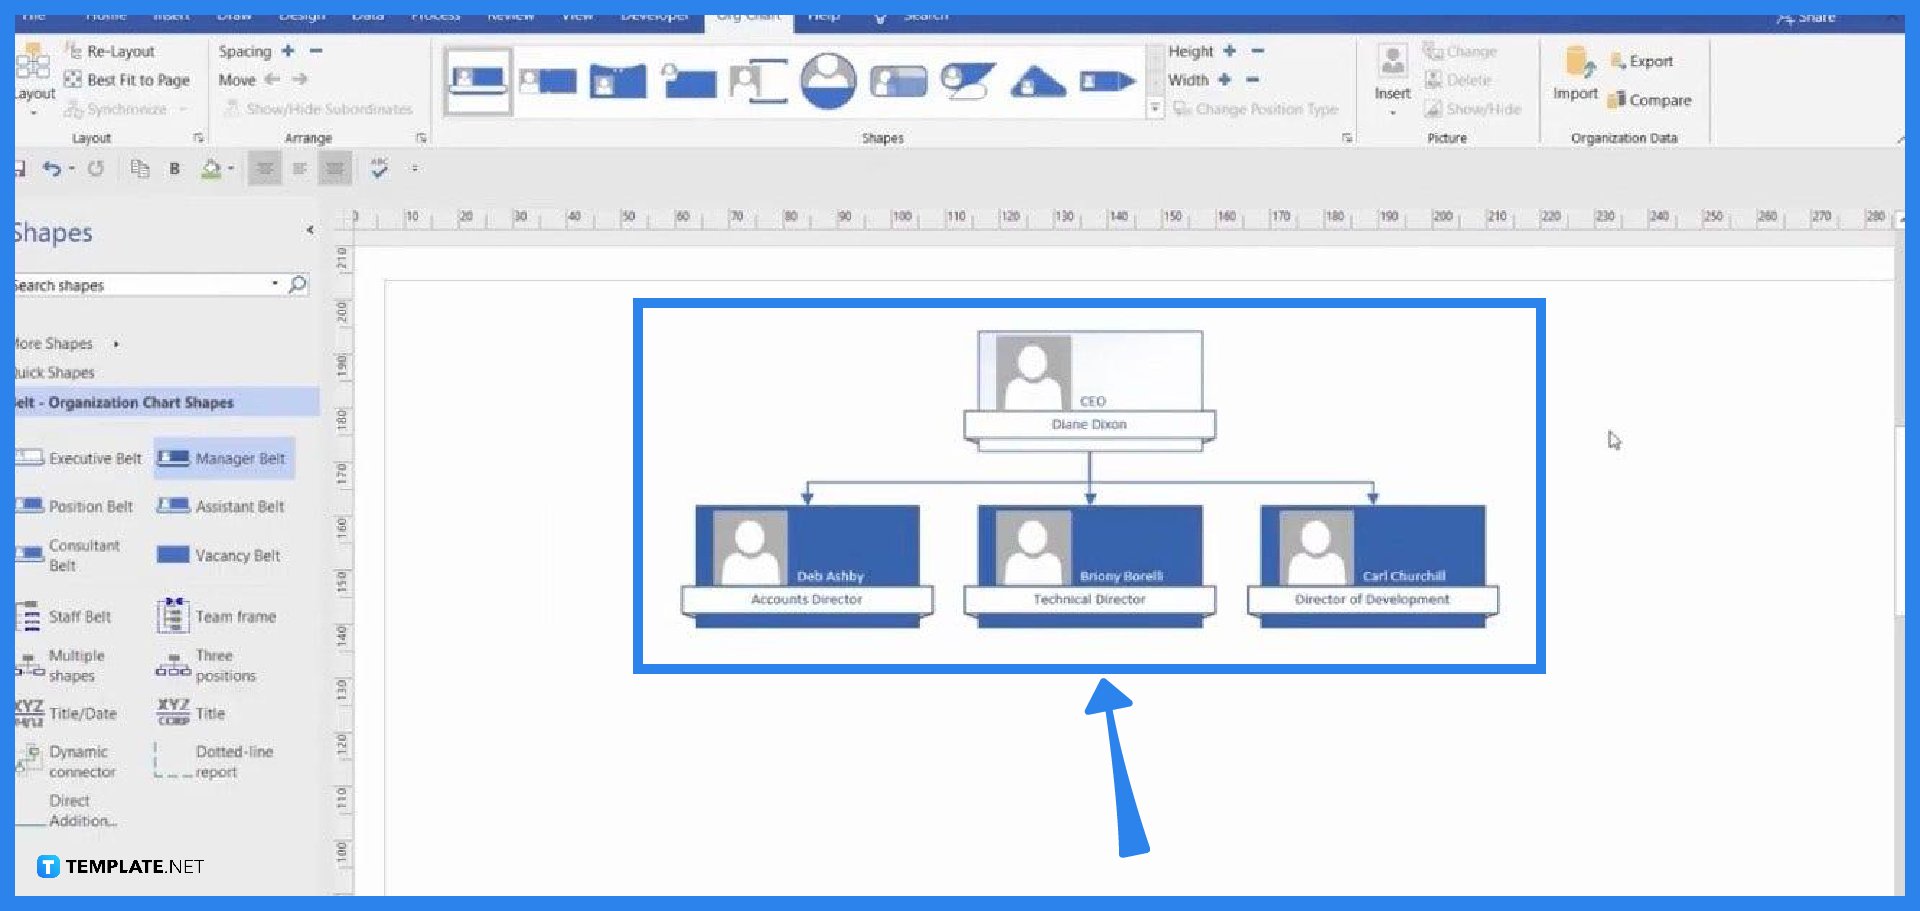
Once you’re on the workstation, just grab the Executive stencil and place it in the center; since this project is an organization chart, understandably, there will be subordinates. To add the second highest position under the CEO, just drag the Manager belt and drop it on the CEO object—this will automatically create a subordinate link with arrows that link the shapes. Repeat this process to add the necessary number of subordinates to your chart. -
Step 3: Add Subordinates under Manager Belt
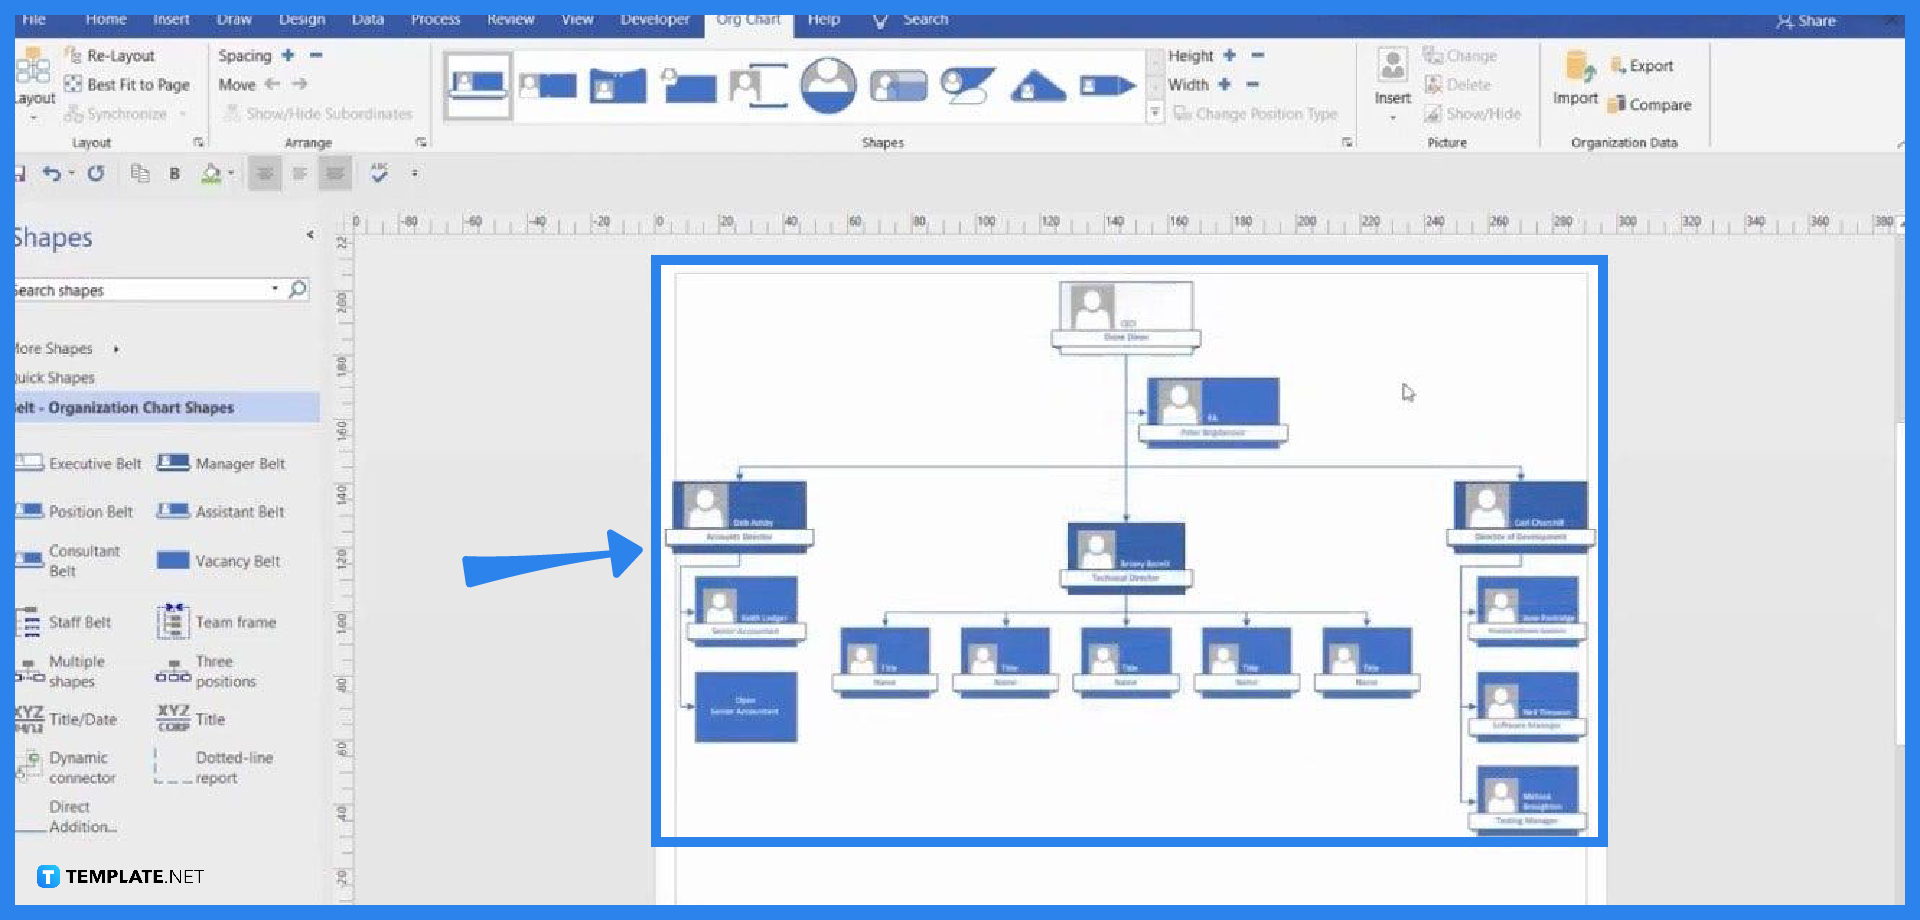
Just as you can add managers under the CEO stencil, you can also add subordinates under the managers, for example. Visio has two tools that quicken this process: Three Positions and Multiple Positions stencils. If there are three designated people under a particular higher position, you can use the former, and if there are more than three, just drag the latter stencil and drop it on the manager belt they’re associated with.
-
Step 4: Fit Organization Chart to Page

Let’s say the organization chart you built does not fit a single page, there are a few ways to remedy that. The fastest way is to highlight the whole chart then go to the Layout group and click Best Fit to Page; if this doesn’t work, you can adjust the width of the subordinates by highlighting them and then decrease the width by clicking the minus sign until the preferred size. Another way is customizing the spacing between the manager belts by dragging the extremes to the sides until they align with the margin and then changing the layout of the series of subordinates that need adjustment—to do this, highlight the shapes, click the Layout button below File, then choose Horizontal Center.
FAQs
What is the difference between using a Class Diagram template and using an Organization Chart template?
Both of these templates are similar; however, they are designed to accommodate information according to their respective functions: a class diagram doesn’t have automatic functions of linking members of a hierarchy just as an organization chart doesn’t have stencils that help create classes easily.
Can I export data from Excel to Microsoft Visio?
Yes, you have the option at the beginning of creating a chart where an Organization Chart Wizard window appears then lets you choose between transferring data from the Excel spreadsheet to your organization chart in Microsoft Visio or manually inserting information in the application.
How do I add multiple shapes under another shape?
If you want to add multiple shapes, you can simply click the Multiple Positions stencil and drop it on a particular shape; there will be a widow that will pop up where you can choose the number of shapes and their label or title.
How do you adjust the size of a shape?
Highlight a specific shape then click the add or minus button of either Height or Width next to the shape designs above the page.
What is the use of a Vacancy Belt?
The vacancy belt is used when, for example, there is a vacant position within the organization that needs to be filled.

