
How to Connect Access with Microsoft SharePoint
Microsoft SharePoint is one of the products within the Microsoft product suite where you can access more applications integrated into…
Mar 17, 2023
Access Microsoft Visio on your PC or mobile device to graphically arrange complicated concepts. Begin your Visio projects with hundreds of templates, such as flowcharts, timetables, and floor layouts, to save you time and effort.
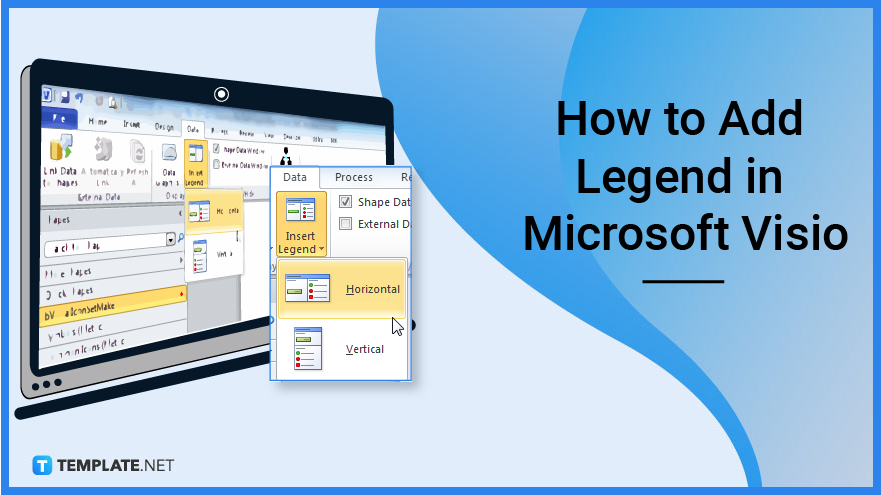
You may have a preference to remove text labels from data graphics in your diagram or to employ data graphics that are not meant to contain labels. Adding a legend to your diagram to illustrate the meanings of certain symbols will help to portray them better.
You will first need to open your Microsoft Visio account by logging in with your details. Either as desktop software or accessing it through the web are options for you as long as you can edit it. Proceed to open the file you would want to add a legend to or an example you want to use to follow along with the guide.
After opening the file you would want, you can then add a legend. Click the arrow next to “Insert Legend” on the “Data” tab’s “Display Data group.”
You do have the option to select which direction the legend would run to depending on whether you want the legend to run horizontally or vertically, click “Horizontal” or “Vertical.” The legend displays the data bars, icons, and color values that are currently in use on the page. You can pick and eliminate unnecessary information. Other options to edit the legend include changing the wording or adding new shapes.
Legends are not automatically updated when you modify something in the diagram, you must enter a new legend to reflect the changes. To do so, transfer the customized legend to an empty space, then when you insert a new legend, you can select which version you want to keep. Delete the legend you don’t intend to use and move the updated legend to where you want to place it on the diagram.
You have the option of whether to add a vertical or horizontal legend.
Select “Task Panes” in the Show group on the “View” tab, and then click “Shape Data” as this toggles the appearance of the Shape Data task pane.
A subprocess flowchart may be defined as the depiction of an activity that consists of a succession of tiny sections; that is, this activity can be represented by a process flowchart since it is inserted into a Process flow chart.
A legend is an element that you may add to your diagram to offer information about the colors, line thicknesses, and styles, specifically the colors and other styles that have a specific meaning.
A caption, title, or brief explanation attached to an article, artwork, cartoon, or billboard is referred to as a legend while a key is a set of symbols that explain how they are used in a map, table, etc.

Microsoft SharePoint is one of the products within the Microsoft product suite where you can access more applications integrated into…
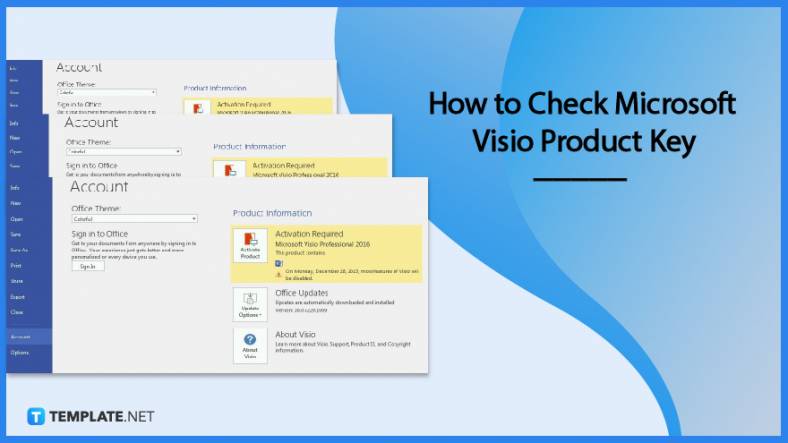
Finding a product key for the Microsoft Visio software only takes a few clicks and doesn’t require a diagrammed process.…

With Microsoft Visio, collaborating and editing drawings online is entirely possible. In addition to that, templates and various selections of…

Microsoft Publisher is an easy-to-use publishing software application that users in this DIY age can optimize to produce digital content…
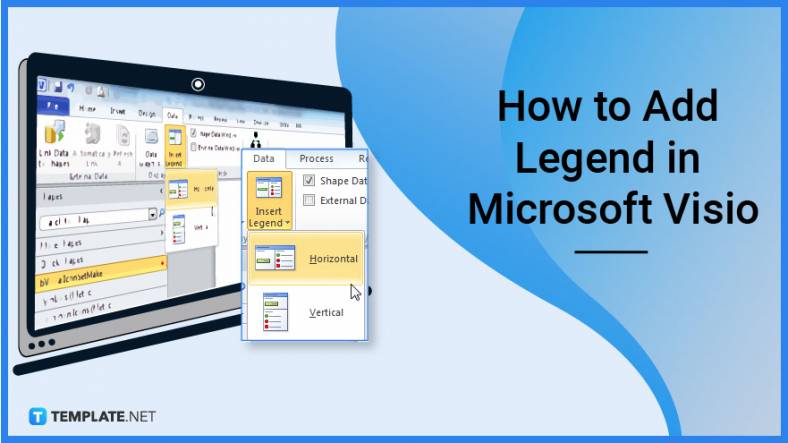
Access Microsoft Visio on your PC or mobile device to graphically arrange complicated concepts. Begin your Visio projects with hundreds…
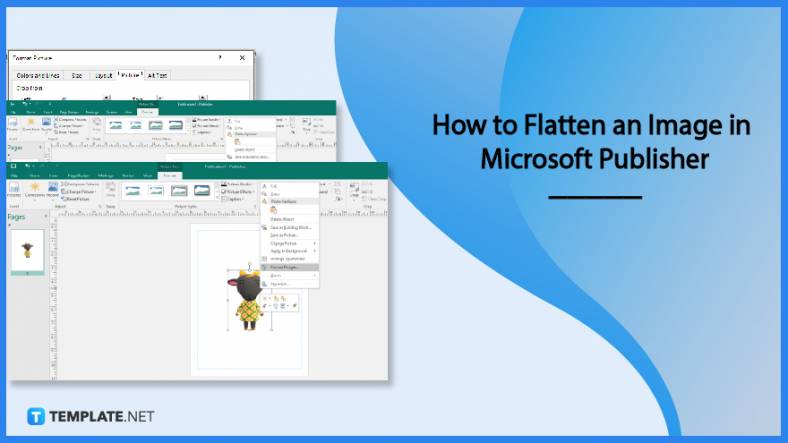
Flattening an image means reducing the file size of the image, which will make saving and printing much easier. So,…

Microsoft Visio lets you create professional diagrams and flowcharts for various purposes and occasions. It also enables you to collaborate…
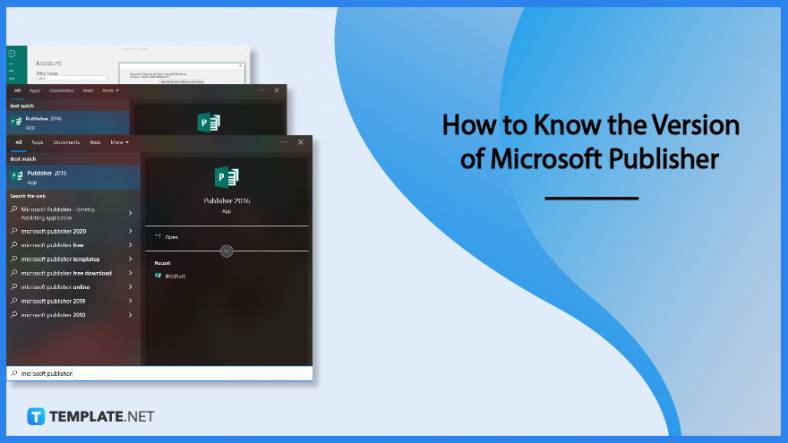
Knowing the version of Microsoft Publisher installed on your computer is also helpful when downloading templates and add-ins because some…
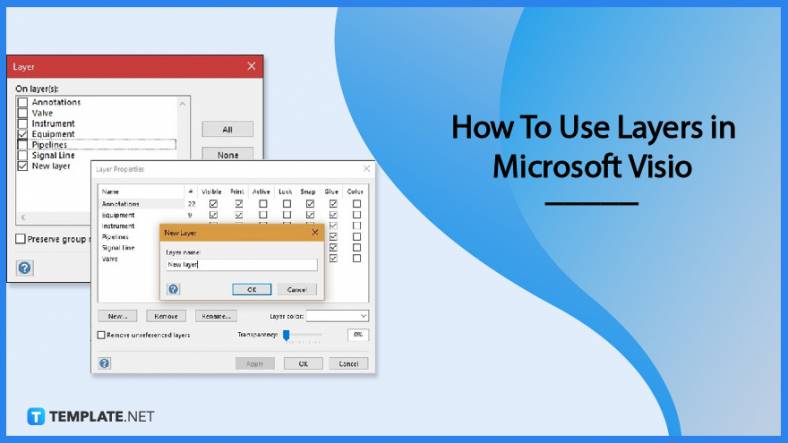
Microsoft Visio is an excellent tool and application for creating visual representations of flows and processes using creative and beautiful…