Table of Contents
How to Make/Create a Chart in Google Docs [Templates + Examples] 2023
Charts have long been a primary tool used by humanity to organize, interpret, analyze, and present data and information. With the rise of advanced technology, it’s safe to say that charts will stick around perpetually.
Create a Chart in Google Docs – Step-by-Step Guide
Each of us should know how to create charts because at some point we’ll need them for work, school, or home use. Google Docs is a great place to start creating charts, so follow this guide.
Step 1: Select a Good Chart Template
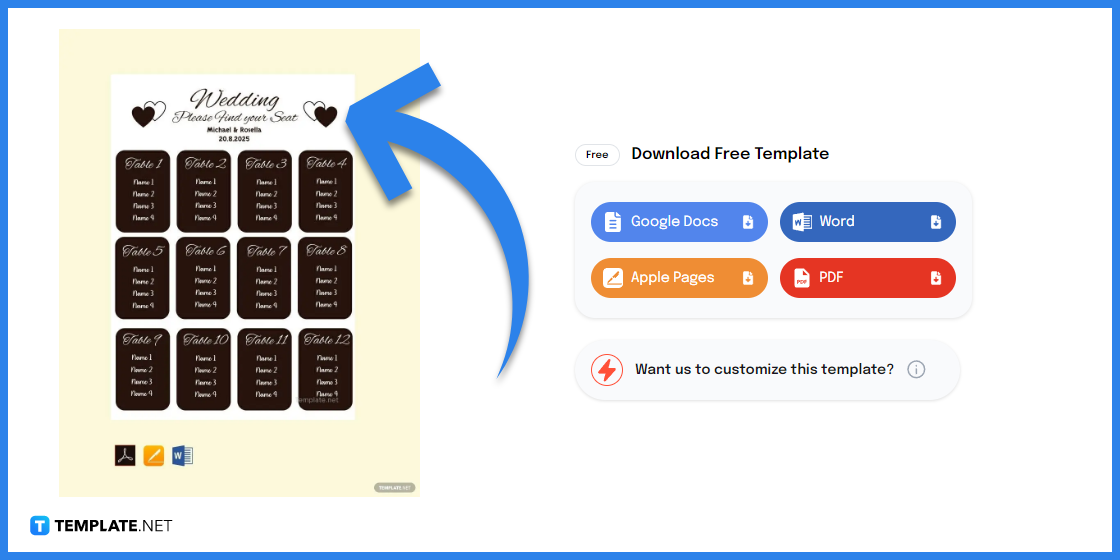
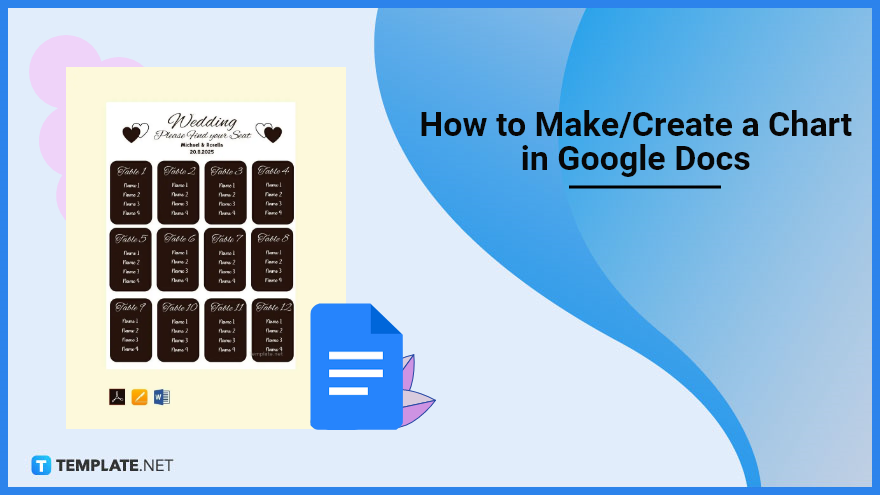
Explore the chart templates page of this site and find a chart template that meets your preferences. One of the chart templates available is the Blank Wedding Seating Chart Template which is useful for wedding planning.
Step 2: Select Google Docs
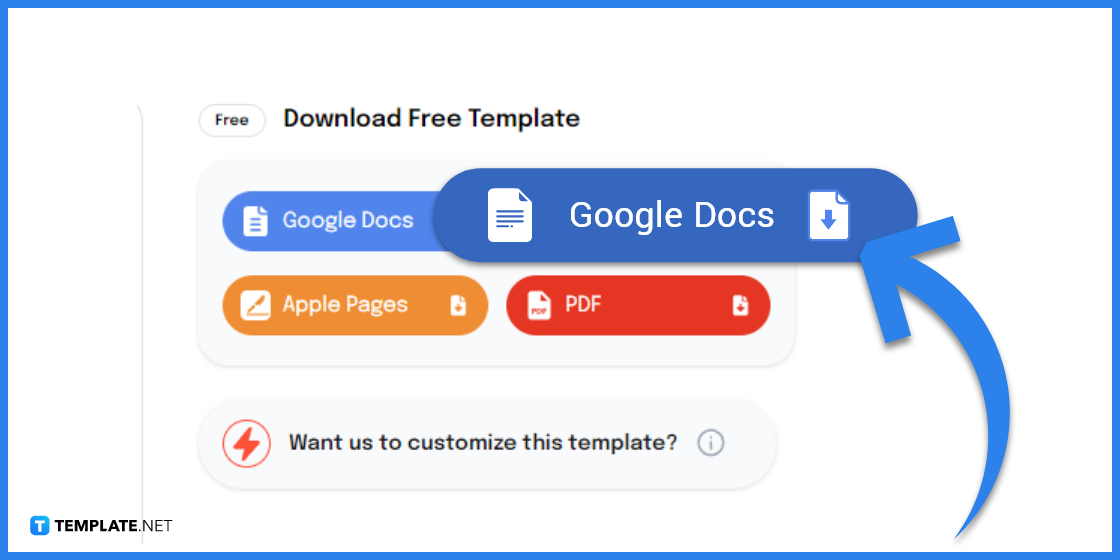
Select the ‘Google Docs’ button in order to open your chosen template in Google Docs. The ‘Download Free Template’ section can be found on the right side of your selected template’s web page.
Step 3: Display the Title of the Chart
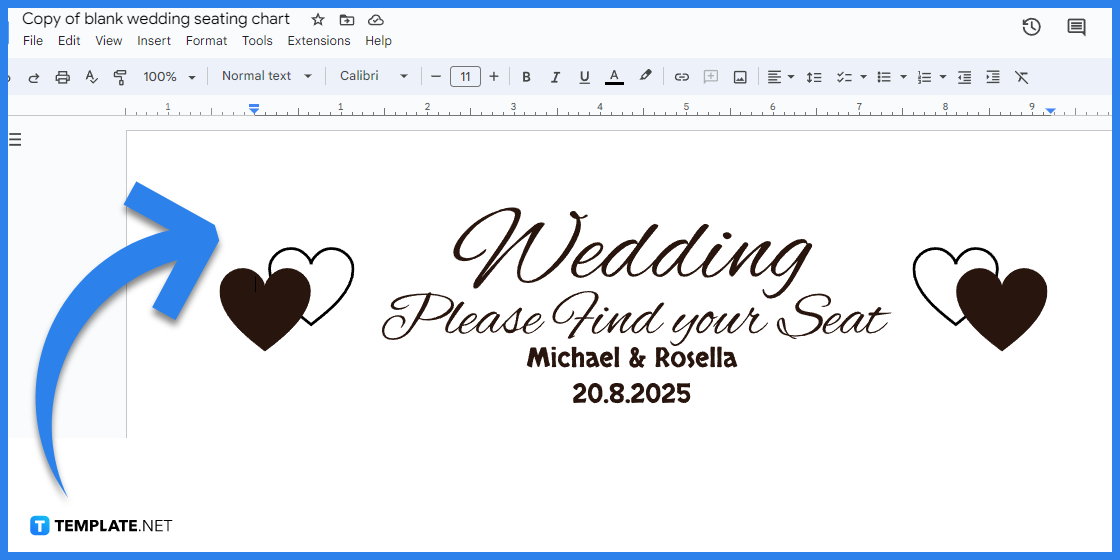
Write the unique custom title of your chart at the top; you can use elegant font styles if you want. This guide uses the Blank Wedding Seating Chart Template which is why the title it presents in the image above includes the names of the bride and groom.
Step 4: Arrange the Boxes or Tables of the Chart
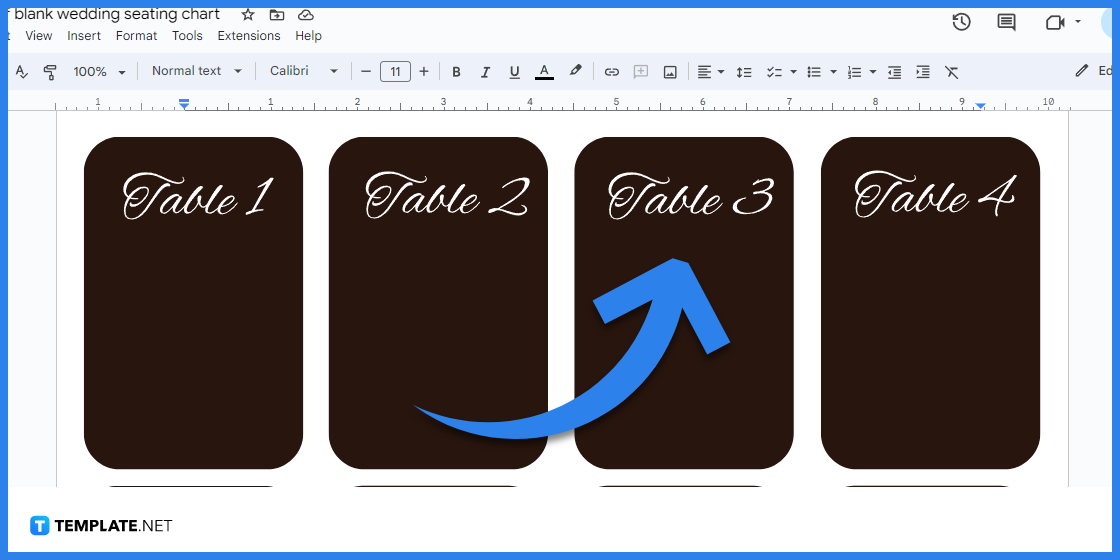
Arrange the boxes and tables of the chart according to your needs; feel free to add more boxes and tables if the template doesn’t provide enough for you. You can also give each box or table a name so you can easily organize them.
Step 5: Input the Information in the Chart
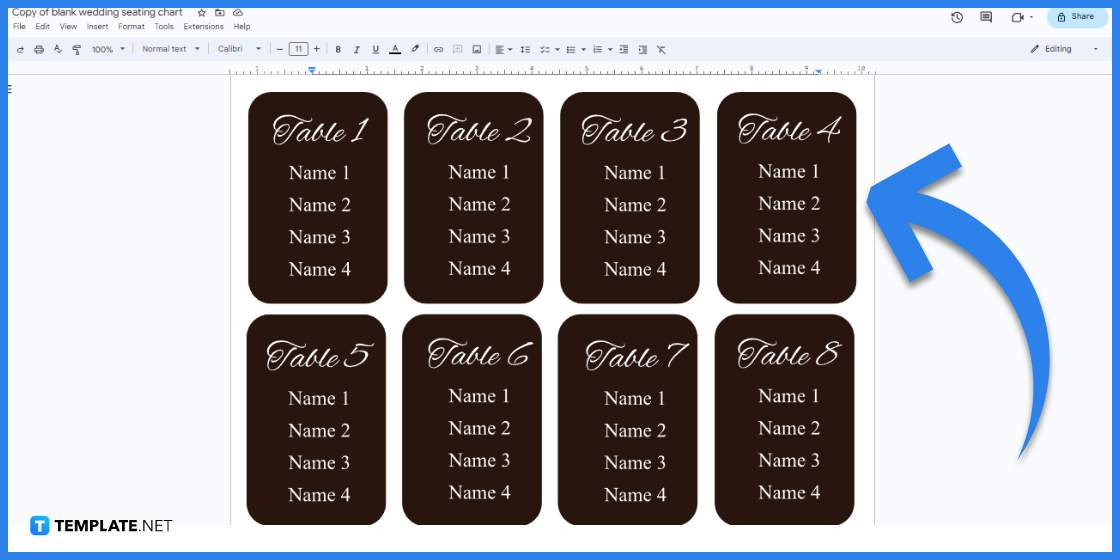
Input all the data and information that your chart needs to present. Make sure to input each piece of info in the right table or box; arrange them chronologically if needed, and if possible, complement them with images or graphics to improve their context.
Step 6: Print Your Chart
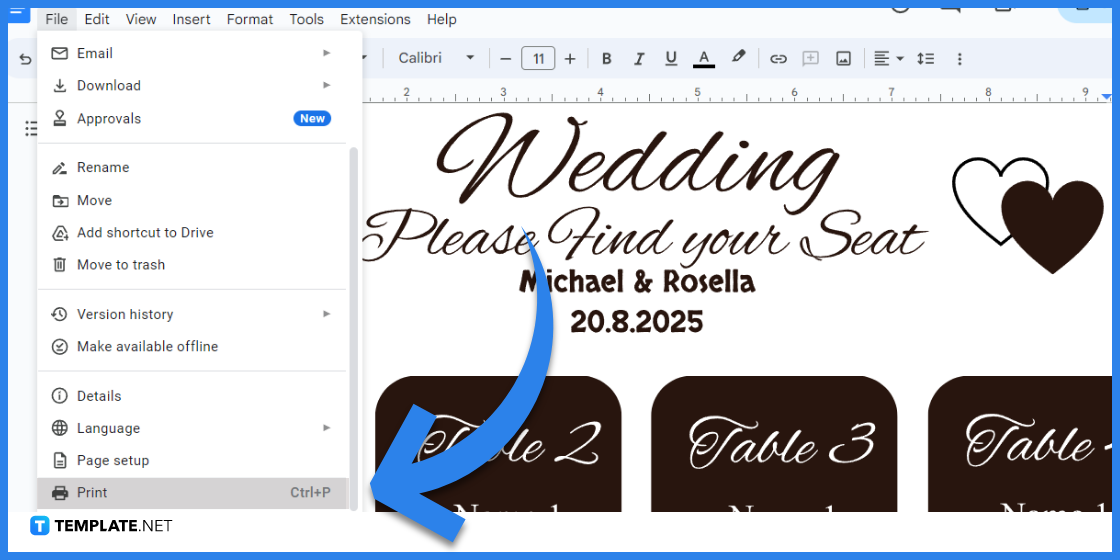
Before you proceed to print your customized chart, take the time to review everything in it from top to bottom; make the corrections if errors are spotted. After reviewing, open the File menu in Google Docs and click the Print option to finally create a printed copy of your customized chart.
Chart Templates & Examples
Discover more high-quality chart templates and examples below to help you in your chart-making project.
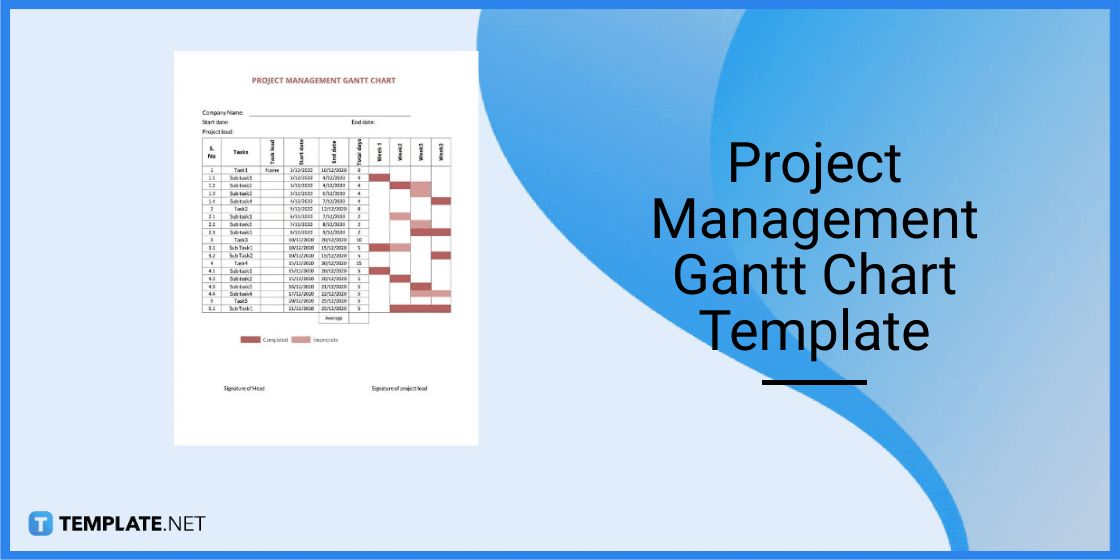
Project Management Gantt Chart Template
The Project Management Gantt Chart Template is a useful asset for project managers and project directors. They can use this to produce a tracker that gives them a clear overview of the progress of their ongoing projects.
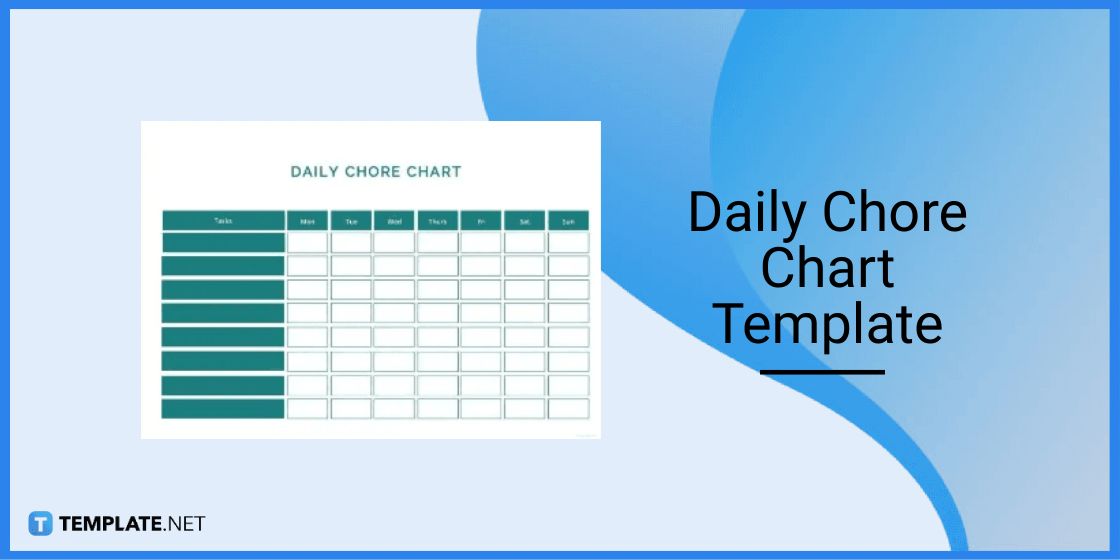
Daily Chore Chart Template
If you need help organizing your chores at home, the Daily Chore Chart Template is for you. With this one, you can easily list down your home tasks for each day of the week; no need to hassle yourself structuring a chart or table from scratch.
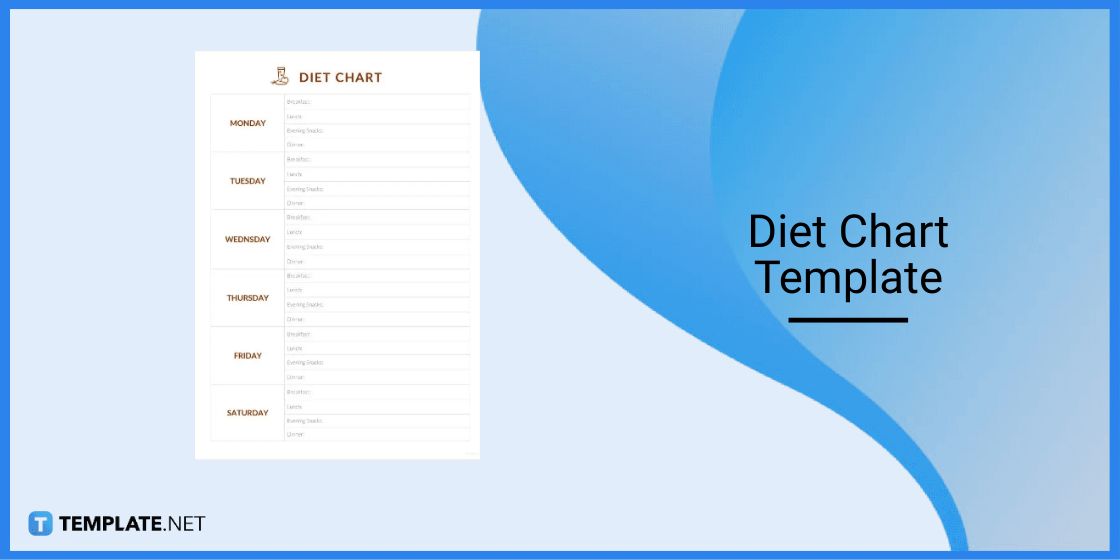
Diet Chart Template
The Diet Chart Template helps its users come up with a simple diet plan that covers all seven days of the week. It’s specifically made for people who’ll take on the challenge of changing their diet to improve their health.
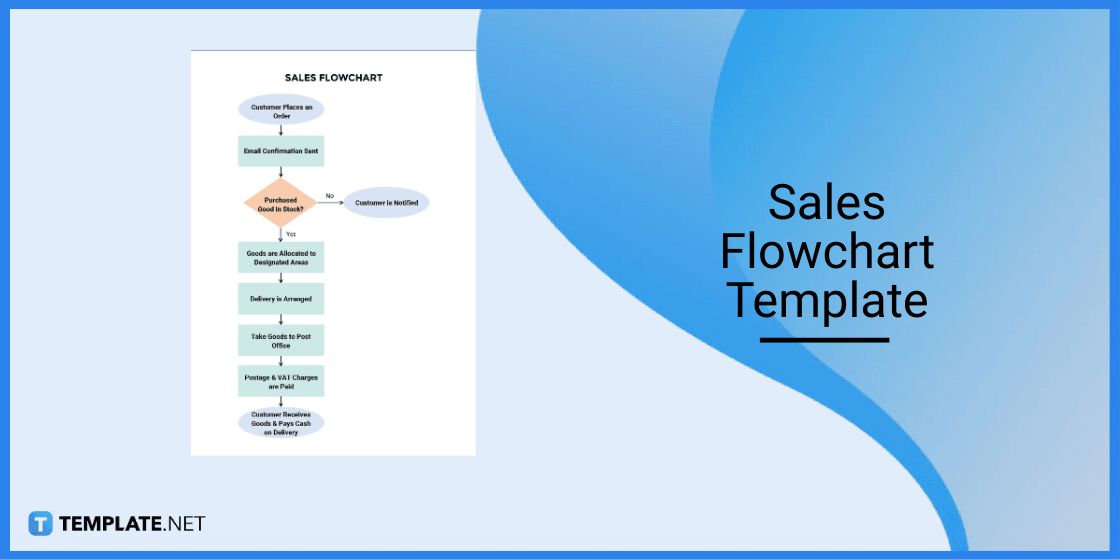
Sales Flowchart Template
The flow of a company’s sales operations can easily be summarized using the Sales Flowchart Template. Sales teams can also use it to plan their day-to-day operations and ensure they meet their targets consistently.
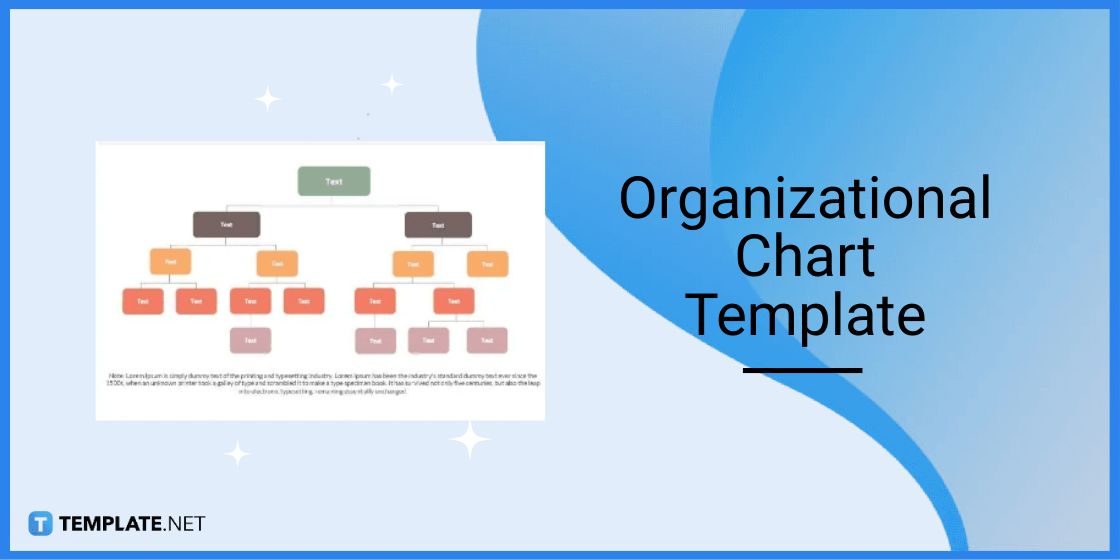
Organizational Chart Template
Organizations need organizational charts to establish a clear chain of command within their ranks. Companies that are new in their industry can benefit from the Organizational Chart Template to build a proper hierarchy among their members.
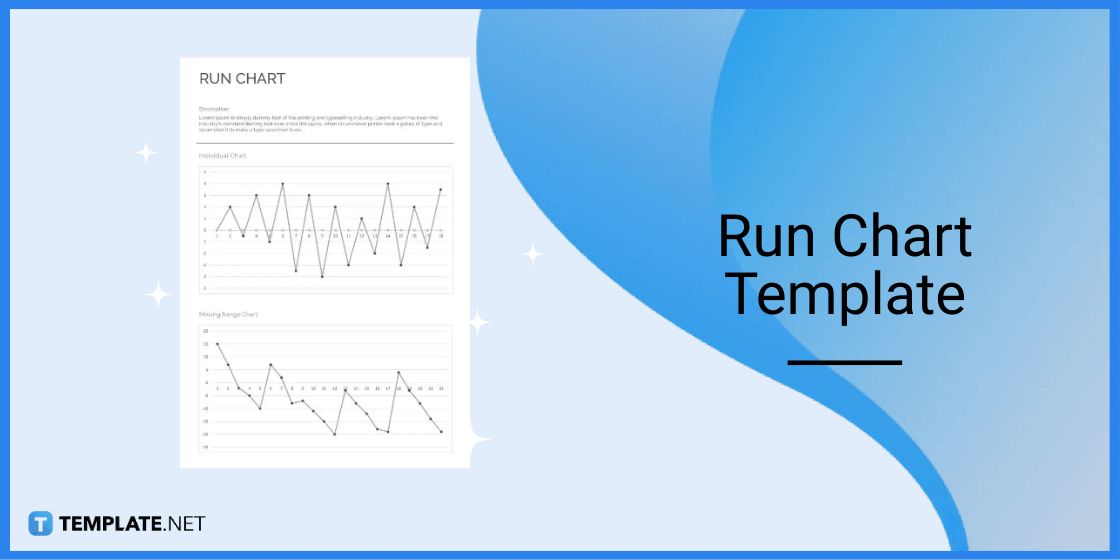
Run Chart Template
A chart template like the Run Chart Template is the best kind for comparing and analyzing big loads of data. Companies from any industry can certainly make use of it, and also individuals who study data as a hobby.
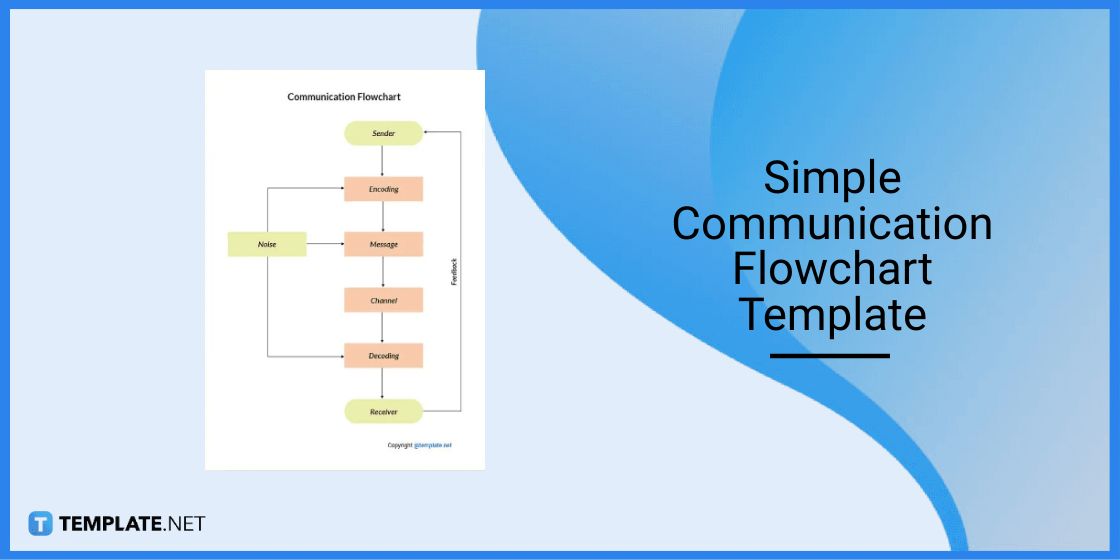
Simple Communication Flowchart Template
Organizations need to plan the flow of their communication so everyone in their ranks will be on the same page. For that reason, the Simple Communication Flowchart Template was created so teams can conveniently construct a proper flow in their communication methods.
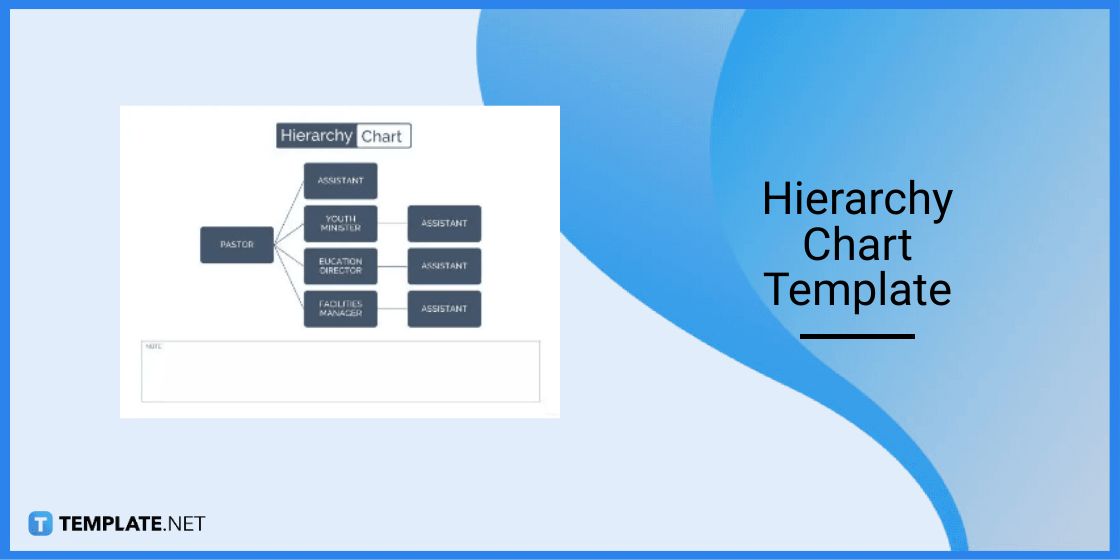
Hierarchy Chart Template
The Hierarchy Chart Template is similar to the Organizational Chart Template, but it’s horizontal. Organizations can also use it to build their organizational charts and emphasize the job title or position of each of their members.
Gadget Comparison Chart Template
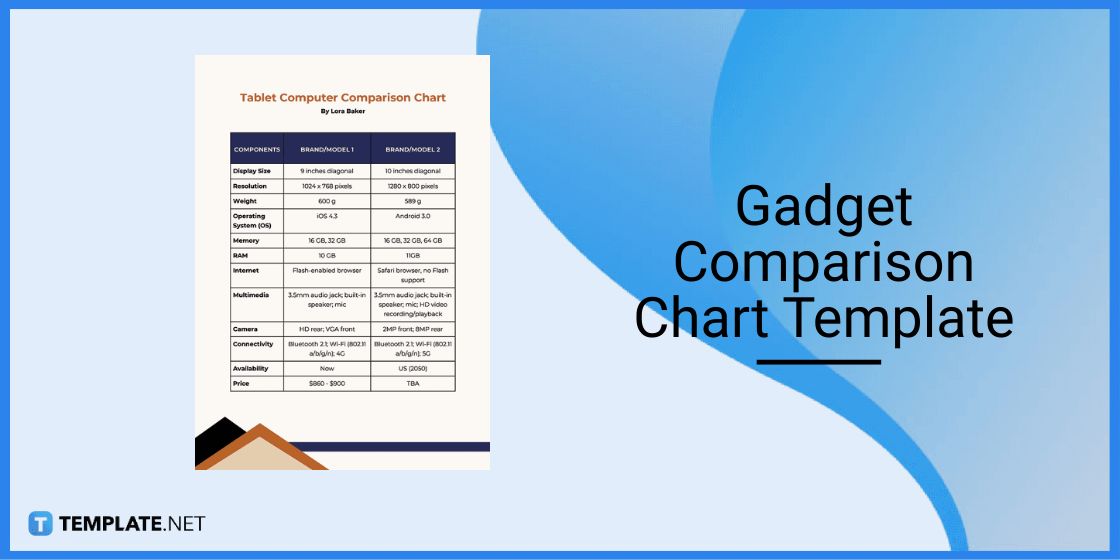
The Gadget Comparison Chart Template is a great tool for gadget reviewers who constantly compare two similar gadgets with the same function but made by different tech companies. The structure of this chart template makes it easier for its users to compare the specs of two products side by side.
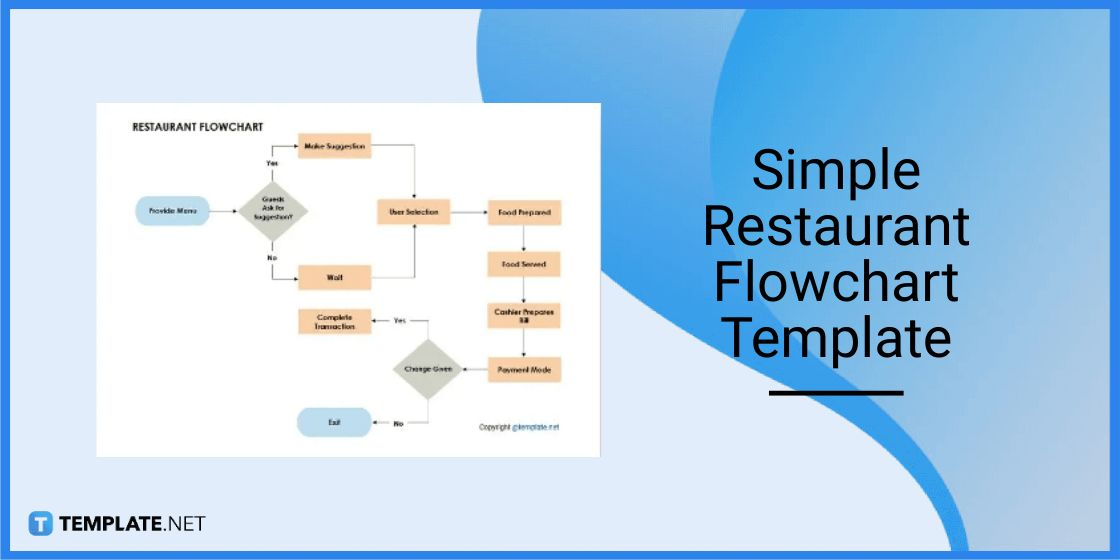
Simple Restaurant Flowchart Template
The Simple Restaurant Flowchart Template helps restaurant managers to plan out the flow of their food and beverage services. Having a clear flowchart helps a restaurant’s service team to be reminded of its standard operating procedures or SOP.
FAQs
Do charts have to be simplified?
As much as possible, charts have to be simplified so it’ll be easier for the readers to understand or analyze the data and information being presented.
What are the typical types of charts?
The types of charts that are most popular are line charts, area charts, bar charts, pie charts, Gantt charts, comparison charts, flowcharts, and organizational charts.
What are the types of charts best for comparing data?
The best types of charts for comparing data are bar charts, pie charts, comparison charts, line charts, and Gantt charts.
Is it okay to insert graphics and images in a chart?
Yes, it’s highly recommended to include graphics and images in charts because they can support the information conveyed by the text, and on top of that, they enhance the presentability of charts.
Should students at school learn about charts?
Yes, students at school should learn about charts and how to make them using digital tools; charts will be part of their advanced academic journey and their professional journey later on.
